


PowerColor HD4870 512MB PCI-E

Test Setup
A common mistake made when benchmarking graphics cards is that the rest of the PC system isn’t sufficient enough to test the GPU to its limits. This results in a bottleneck situation, where the system can only run at the speed of its slowest component. For this reason, the test configuration chosen below has been specially selected to give each of the graphics cards on test the headroom they require in order to produce the best results.
A selection of games and benchmark suites has also been chosen to test each of the cards with several game engines. Each of the cards will be run at both low and high resolutions with varying levels of texture filtering to represent the use of the card with both small and large screen sizes.
3DMark05
1024×768 / 0xAA / 0xAF (Default)
1920×1200 / 4xAA / 0xAF
1920×1200 / 4xAA / 0xAF
3DMark 06
1280×1024 / 0xAA / 0xAF
1920×1200 / 4xAA / 0xAF
1280×1024 / 0xAA / 0xAF
1920×1200 / 4xAA / 0xAF
3DMark Vantage
1280×1024 / Performance Mode
1900×1200 / Extreme Mode
Quake4
1280×1024 / Ultra / 4xAA / 4xAF
1920×1200 / Ultra / 4xAA / 4xAF
1920×1200 / Ultra / 4xAA / 4xAF
Unreal Tournament III
1280×1024 / DX10 / High / 0xAA / 0xAF
1920×1200 / DX10 / High / 0xAA / 0xAF
1920×1200 / DX10 / High / 0xAA / 0xAF
Call of Duty 4
1280×1024 / Max / 4xAA / 4xAF
1920×1200 / Max / 4xAA / 4xAF
1920×1200 / Max / 4xAA / 4xAF
F.E.A.R
1280×1024 / Max / 4xAA / 4xAF
1920×1200 / Max / 4xAA / 0xAF
1280×1024 / Max / 4xAA / 4xAF
1920×1200 / Max / 4xAA / 0xAF
BIOSHOCK
1280×1024 / DX10 / High / 0xAA / 0xAF
1920×1200 / DX10 / High / 0xAA / 0xAF
1280×1024 / DX10 / High / 0xAA / 0xAF
1920×1200 / DX10 / High / 0xAA / 0xAF
Crysis
1280×1024 / DX10 / High / 0xAA / 0xAF
1920×1200 / DX10 / High / 0xAA / 0xAF
1920×1200 / DX10 / High / 0xAA / 0xAF
As two of the cards used in today’s review (the ASUS GTX260 TOP and MSI GTX280) are factory overclocked, it would be unfair to directly compare these to the stock-clocked PowerColor HD4870 without giving the card some additional overclocking of its own. Therefore, in the results over the next few pages you will see the HD4870 results alongside a set of “HD4870 OC” results which have been performed at the core/memory speeds shown in the overclocking section below.
During the benchmarking phase, we will be using the following prices extracted from aria.co.uk on 22/07/08 to produce our CPF graphs. Please remember that these graphs are static and only represent a snapshot of the market at the time of this review.
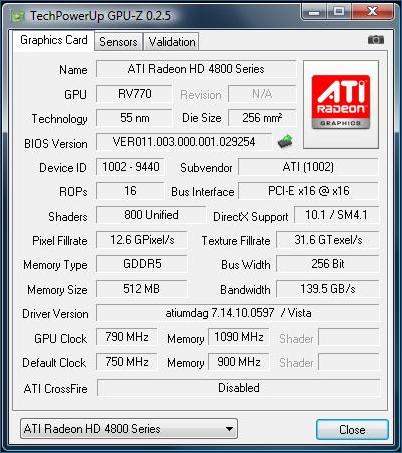
Overclocking
Using only the the ATI Overdrive™ facility built into the driver control panel, the maximum overclock we were able to obtain from the HD4870 was 790mhz on the core and 1090mhz on the memory. With further fine tuning and a utility such as ATITool that allows selection of settings much higher than this, we are confident that the PowerColor HD4870 could have done even better.
Now let’s get on to the benchmarks…