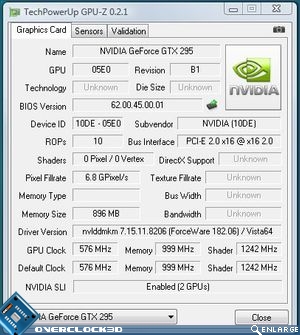
Zotac GTX295 PCIe Graphics card
Test Setup
To ensure that all reviews on Overclock3D are fair, consistent and unbiased, a standard set of hardware and software is used whenever possible during the comparative testing of two or more products. The configurations used in this review can be seen below:
CPU: Intel Nehalem i7 920 Skt1366 2.66GHz (@3.835 Ghz)
Motherboard: Gigabyte EX58-UD5
Memory: 3x2GB Corsair DDR3 1600mhz @ 8-8-8-24
HD : Hitachi Deskstar 7k160 7200rpm 80GB
GPU: Zotac GTX295
Graphics Drivers: GeForce 182.06
PSU: Gigabyte ODIN 1200w
During the testing of the setups above, special care was taken to ensure that the BIOS settings used matched whenever possible. A fresh install of Windows Vista was also used before the benchmarking began, with a full defrag of the hard drive once all the drivers and software were installed, preventing any possible performance issues due to leftover drivers from the previous motherboard installations. For the 3DMark and gaming tests a single card configuration was used.
To guarantee a broad range of results, the following benchmark utilities were used:
• 3DMark 05
• 3DMark 06
• 3DMark Vantage
3D Games
• Crysis
• Far Cry 2
• Oblivion
• Race drive: GRID
• Call of Duty IV
• Unreal Tournament III
Power Consumption
Power consumption was measured at the socket using a plug-in mains power and energy monitor. Because of this, the readings below are of the total system, not just the GPU. Idle readings were taken after 5 minutes in Windows. Load readings were taken during a run of Crysis.
Temperatures
Temperatures were taken at the factory clocked speed during idle in Windows and after 10 minutes of running Furmark with settings maxed out (2560×1600 8xMSAA). Ambient temperatures were taken with a household thermometer. As we use an open test bench setup consideration should be given to the fact that the temperatures would likely increase further in a closed case environment.
Â
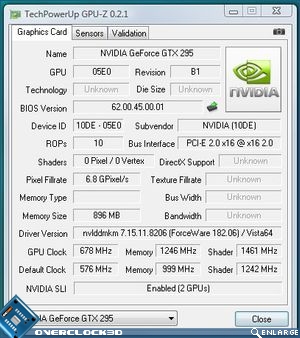
Overclocking


