

CoolerMaster MasterLiquid 240 AIO Review


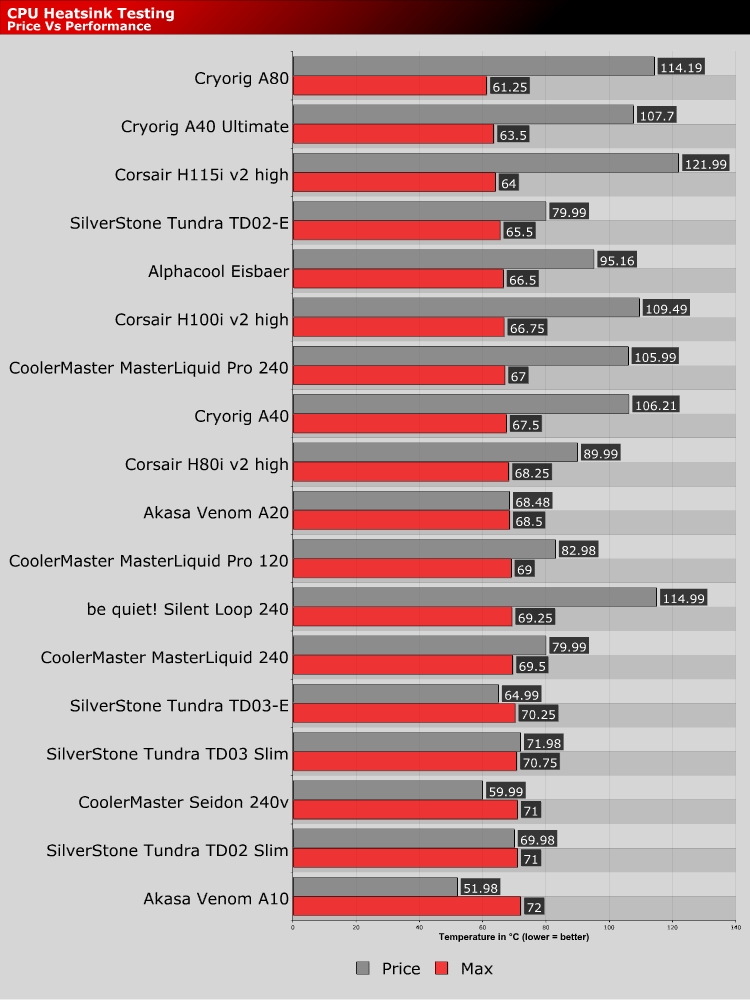
Price Vs Performance
We brought these graphs together initially to help us see which coolers represented the best value. Having done so we thought it might just help you guys in making your purchasing decisions. What you’re essentially looking at below are graphs that illustrates both the cost of the cooler and how it performs relative to the others in the test. The red bars represent the performance figure and the grey bars represent the cost of the cooler. What you’re looking for then is a cooler with a small red bar (low temps) and a grey bar that is also as small as possible (lower price).
7700K 4.8GHz @ 1.25v
In the graph immediately below we’ve kept the overclock down to 4.8GHz in order to show you the full range of coolers. From the off it’s easy to see that on the whole you get what you pay for, with the more expensive coolers garnering better performance results, but there are a few stand outs here.