NVIDIA GTX 280 Performance Revealed – MSI N280GTX
Test Setup
Â
A common mistake made when benchmarking graphics cards is that the rest of the PC system isn’t sufficient enough to test the GPU to its limits. This results in a bottleneck situation, where the system can only run at the speed of its slowest component. For this reason, the test configuration chosen below has been specially selected to give each of the graphics cards on test the headroom they require in order to produce the best results.
Â
Â
A selection of games and benchmark suites has also been chosen to test each of the cards with several game engines. Each of the cards will be run at both low and high resolutions with varying levels of texture filtering to represent the use of the card with both small and large screen sizes.
Â
3DMark05
1024×768 / 0xAA / 0xAF (Default)
1920×1200 / 4xAA / 0xAF
1920×1200 / 4xAA / 0xAF
Â
3DMark 06
1280×1024 / 0xAA / 0xAF
1920×1200 / 4xAA / 0xAF
1280×1024 / 0xAA / 0xAF
1920×1200 / 4xAA / 0xAF
3DMark Vantage
1280×1024 / Performance Mode
1900×1200 / Extreme Mode
Â
Quake4
1280×1024 / Ultra / 4xAA / 4xAF
1920×1200 / Ultra / 4xAA / 4xAF
1920×1200 / Ultra / 4xAA / 4xAF
Â
Unreal Tournament III
1280×1024 / DX10 / High / 0xAA / 0xAF
1920×1200 / DX10 / High / 0xAA / 0xAF
1920×1200 / DX10 / High / 0xAA / 0xAF
Â
Call of Duty 4
1280×1024 / Max / 4xAA / 4xAF
1920×1200 / Max / 4xAA / 4xAF
1920×1200 / Max / 4xAA / 4xAF
Â
F.E.A.R
1280×1024 / Max / 4xAA / 4xAF
1920×1200 / Max / 4xAA / 0xAF
1280×1024 / Max / 4xAA / 4xAF
1920×1200 / Max / 4xAA / 0xAF
Â
BIOSHOCK
1280×1024 / DX10 / High / 0xAA / 0xAF
1920×1200 / DX10 / High / 0xAA / 0xAF
1280×1024 / DX10 / High / 0xAA / 0xAF
1920×1200 / DX10 / High / 0xAA / 0xAF
Â
Crysis
1280×1024 / DX10 / High / 0xAA / 0xAF
1920×1200 / DX10 / High / 0xAA / 0xAF
1920×1200 / DX10 / High / 0xAA / 0xAF
Â
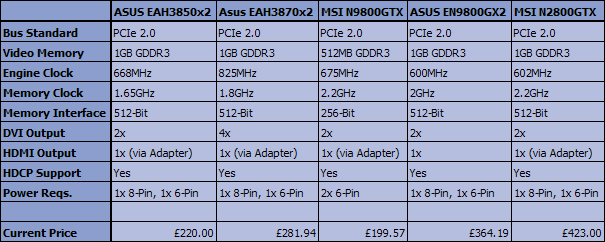
At present, the 3850×2, 3870×2, 9800GTX and 9800GX2 are among the highest performing graphics cards currently available on the market, and for this reason we will be placing the GTX 280 head to head with a stock clocked version of each of these cards. Due care and attention will also be observed when changing between each of the cards, with a fresh install of Vista being deployed to the test system with every driver installation.
Â
A recent feature to enter the Overclock3D GPU review system is the “Cost per FPS” scale. This scale gives a rough indication of which card offers the best bang per buck based on the price of each card at the time of this review. Under normal circumstances, this scale would be based on the exact retail price of each card from a single retailer. However, as MSI have only speculated a release price of £420 for the GTX 280, we will be using this figure along side the current retail price for the remainder of the cards as listed at aria.co.uk.
Â
Â
When viewing the CPF results for each card, we obviously need to take into consideration that the launch price of the MSI N280GTX will be much higher than the rest of the cards listed as they have all had 6 months+ to settle into the market. Nevertheless, it will still be interesting to see if the increased performance of the GTX 280 comes anywhere near to justifying its launch price. In addition, with the release of ATI’s 4800 series on the horizon, we will also be using the same scale to perform a comparison of both NVIDIA’s and ATI’s flagship cards.
Â
Â
Overclocking
Â
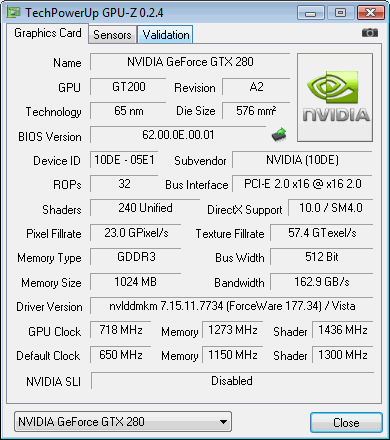
Using the NVIDIA nTune utility along with it’s inbuilt stability tester to test for artifacts, the maximum overclock we managed to achieve on the GTX 280 was 718mhz / 1273mhz /1436mhz for the GPU, Memory and Shaders respectively. This gave a reasonable 11% increase in our 3DMark Vantage score (5063 to 5624 @ Extreme settings) and an impressive 20% increase in our Crysis 1900×1200 results (40.38fps to 48.12fps).
Â
Â
Now lets get on to the benchmarks…


