


Nvidia RTX 2080 and RTX 2080 Ti Review


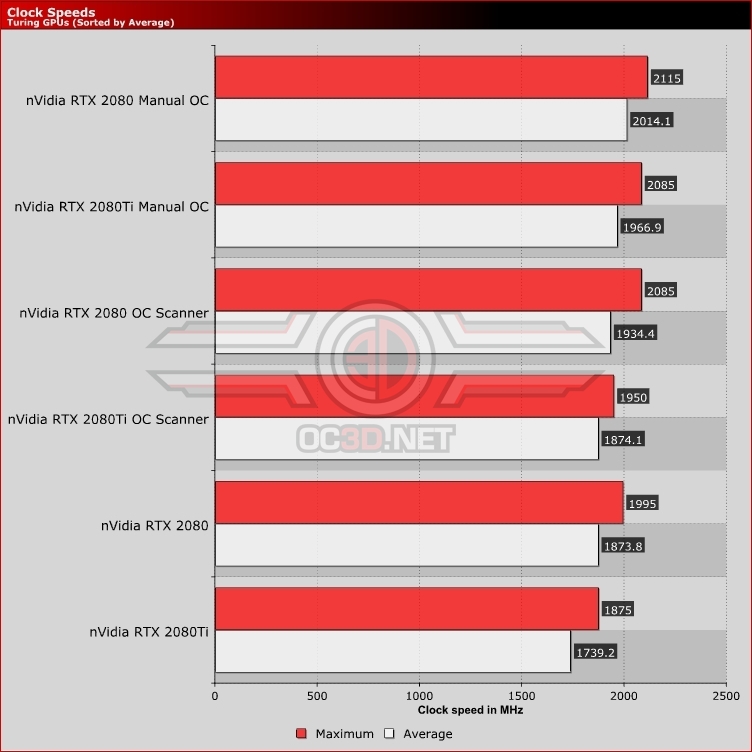
Average Clock Speeds
As we said on the previous page, maximum boost clocks are all well and good and nice headline grabbing figures, but what really brings home the bacon is average clock speeds. i.e the speed your card is running most of the time. By and large both of the RTX cards do well here, with around a 5% drop from the maximum boost clock to the average. For those of you who demand exact numbers the RTX 2080 is 6.08% slower on average than maximised, whilst 4.77% slower with our overclock in place. For the RTX 2080Ti those figures are 7.24% for the stock card, and 5.66% for the overclocked option.
You can also see how fine the detail on the OC Scanner graph is, and how cleanly it sits somewhere between a stock and overclocked card. We think that’s right. Okay we’d like automatic overclocking that hit the same heights as that which you could manually achieve, but it’s nice to get some reward for time invested whilst also knowing there is a good option for those who just want to fit and forget.